International Union for Conservation of Nature (IUCN) Red List Graphics


Description
Research for David Tilman
July 1, 2015
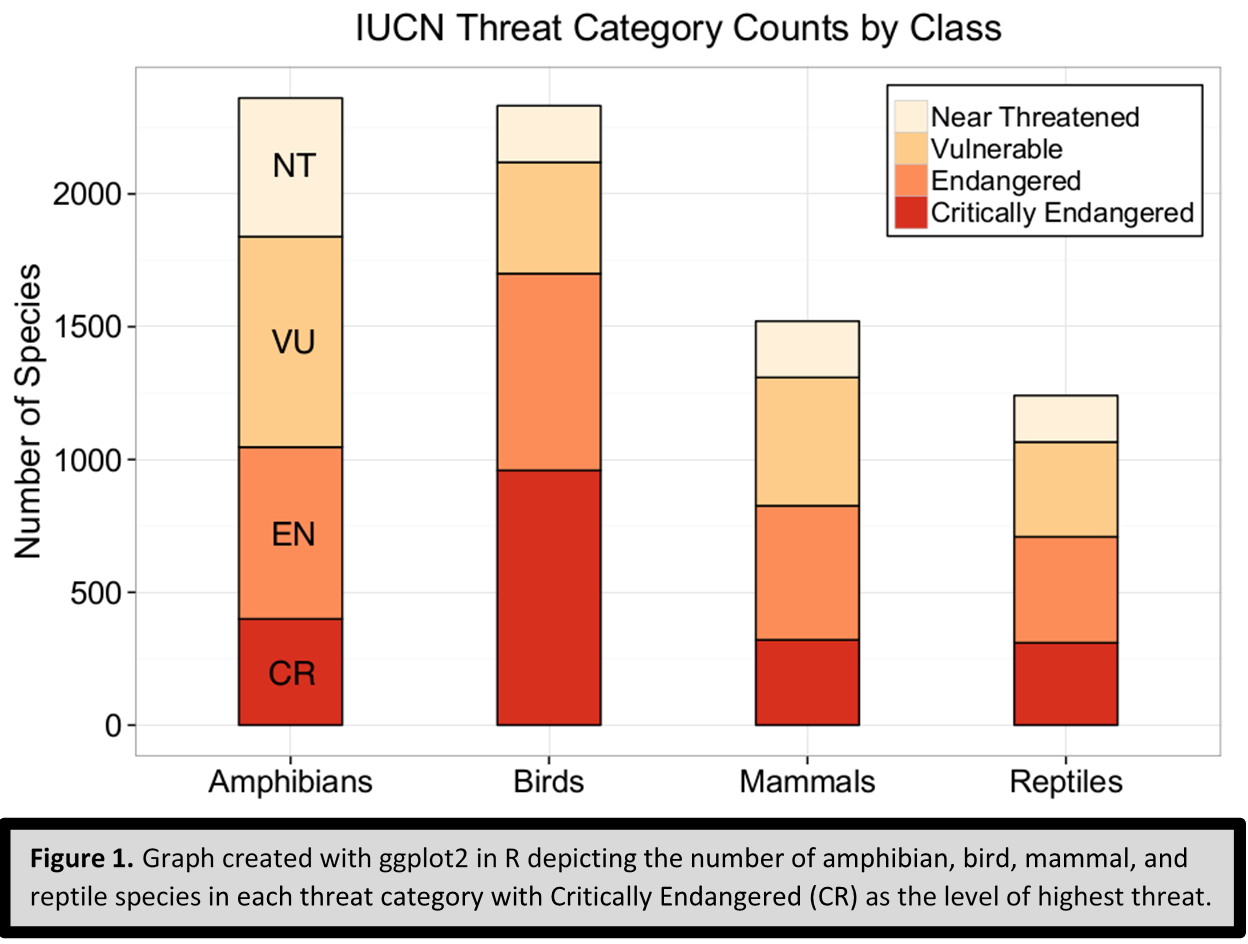
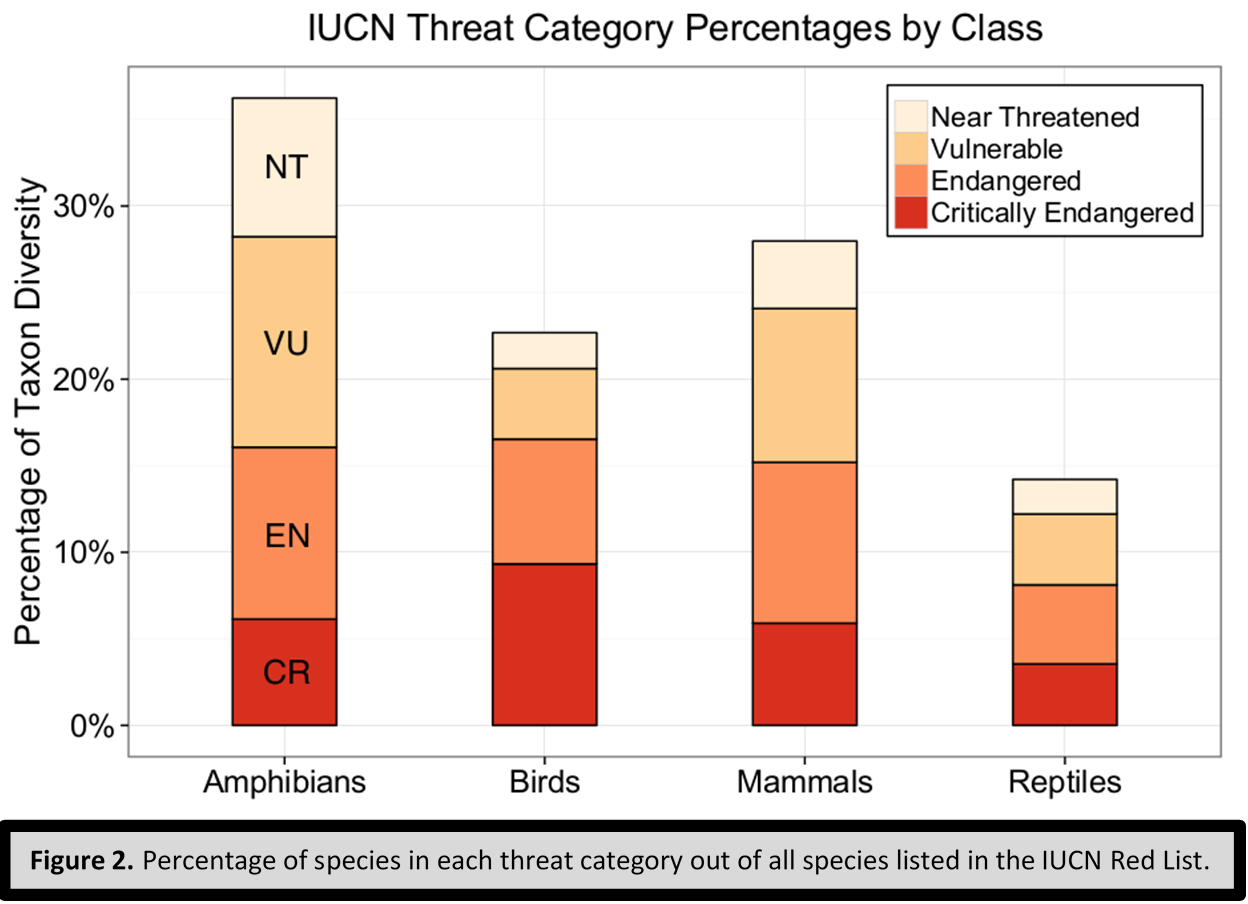
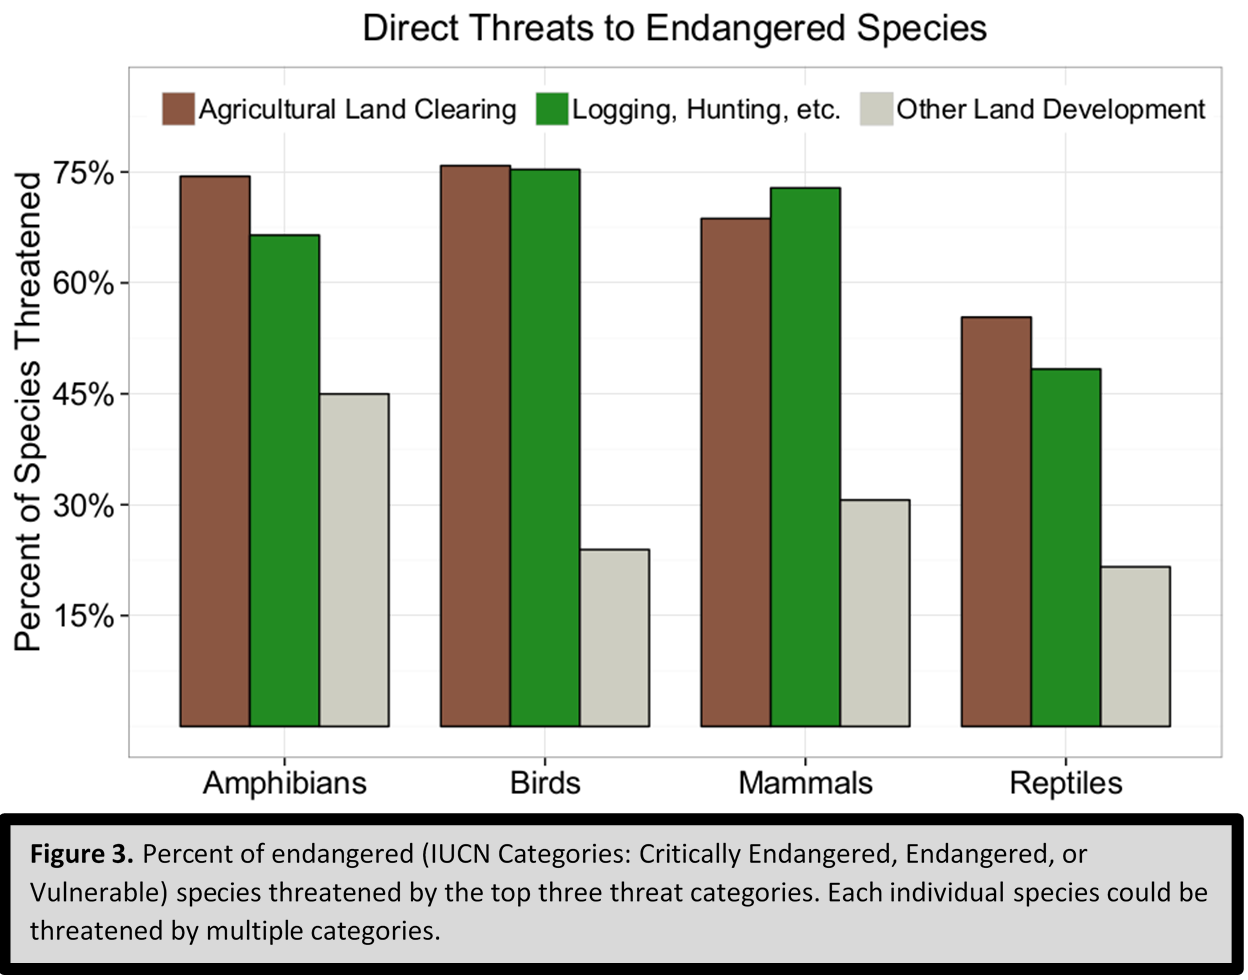
Three simple graphics created with ggplot2 in R to visualize the data mined from the International Union for Conservation of Nature (IUCN) Red List. The graphs were presented to the Ecological Society of America to showcase ongoing research on the connection and significance of agricultural cropland to species endangerment and extinction. The code used to generate these graphics was repurposed for the creation of book graphics on threatened species.
Click to view my GitHub page with code for data mining, analysis and visualization of endangered species data from the IUCN Red List
IUCN 2017. The IUCN Red List of Threatened Species. Version 2017-2. <http://www.iucnredlist.org>.
